Up/down alerts.
From inside your network.
Monitor 43 service types from the agent's own perspective — localhost, LAN, or internet — with TCP, HTTP, DNS, ICMP, and TLS checks. Email, webhook, and in-app alerts out of the box.
Overview
Most uptime monitors check services from the outside. That works for public websites, but it falls apart the moment you want to monitor a Redis on localhost, a LAN-only PostgreSQL, a message broker behind a firewall, or an internal VPN endpoint. ManageLM monitors run from the agent itself, so anything the agent can reach is one click away from being checked.
Each monitor is a small, declarative check — service type, target, interval — that the agent runs locally and reports back. Because the agent is doing the work, the portal never holds a persistent connection to your internal network, and you never have to open ports to a SaaS probe.
Write-optimized data flow. The agent only sends state transitions to the portal — a monitor that stays up writes near-zero database rows. Response time history is rolled up hourly. Thousands of monitors, minimal database overhead.
Service catalog
43 service types across nine categories — each with a ready-made check preset. Adding a new service is a single JSON file, no code changes required.
| Category | Services |
|---|---|
| Web | HTTP / HTTPS, REST API, HAProxy, Squid |
| Network | TCP Port, Ping (ICMP), DNS, NTP |
| SMTP, IMAP, POP3 | |
| Database | MySQL / MariaDB, PostgreSQL, SQL Server, Redis / Valkey, MongoDB, Elasticsearch, Memcached, ClickHouse, InfluxDB, Cassandra, CouchDB |
| Messaging | RabbitMQ, Kafka, NATS, MQTT |
| File Sharing | FTP / SFTP, SMB / CIFS, NFS, AFP, MinIO / S3, WebDAV |
| Remote Access | SSH, RDP, WinRM, OpenVPN, IPsec / IKEv2 |
| Infrastructure | LDAP / LDAPS, Kerberos, Docker API, Consul, Vault, etcd |
| Observability | Prometheus, Grafana, Zabbix |
Under the hood, every service type maps to one of five check protocols the agent natively supports: TCP connect, HTTP request, DNS resolution, ICMP ping, and TLS certificate expiry.
How it works
Create
Open the Monitors page, click Add Monitor, pick a service from the catalog, choose an agent, and set the interval (1m / 5m / 15m / 30m / 1h). Test the check before saving — results appear in the modal immediately.Check
The agent runs the check locally on the configured interval. For TCP and HTTP, an optional SSL toggle enables TLS handshake validation and a days-until-expiry warning — even for self-signed certificates.Transmit on change
The agent reports to the portal only when the status changes (up → down, down → up) or when periodic summaries roll up. Constant-up monitors write virtually nothing to the database.Alert
After a configurable number of consecutive failures (default: 3), an email fires to every user assigned to the target agent. A recovery email fires when the service comes back up.
Alerts
Every monitor has an alerts toggle and a configurable failure threshold. When triggered, ManageLM fans out across three channels simultaneously:
Sent to all users with access to the target agent — direct, group, or admin. Recovery emails fire automatically when the service returns.
Webhook
monitor.down / monitor.up events for Slack, PagerDuty, n8n, Discord — any endpoint that accepts JSON POSTs.
In-app
Notification bell in the portal with full context, linked directly to the monitor detail modal for fast investigation.
No false alarms
The Refresh button runs ad-hoc checks without firing alerts, so manual testing never pages your on-call.
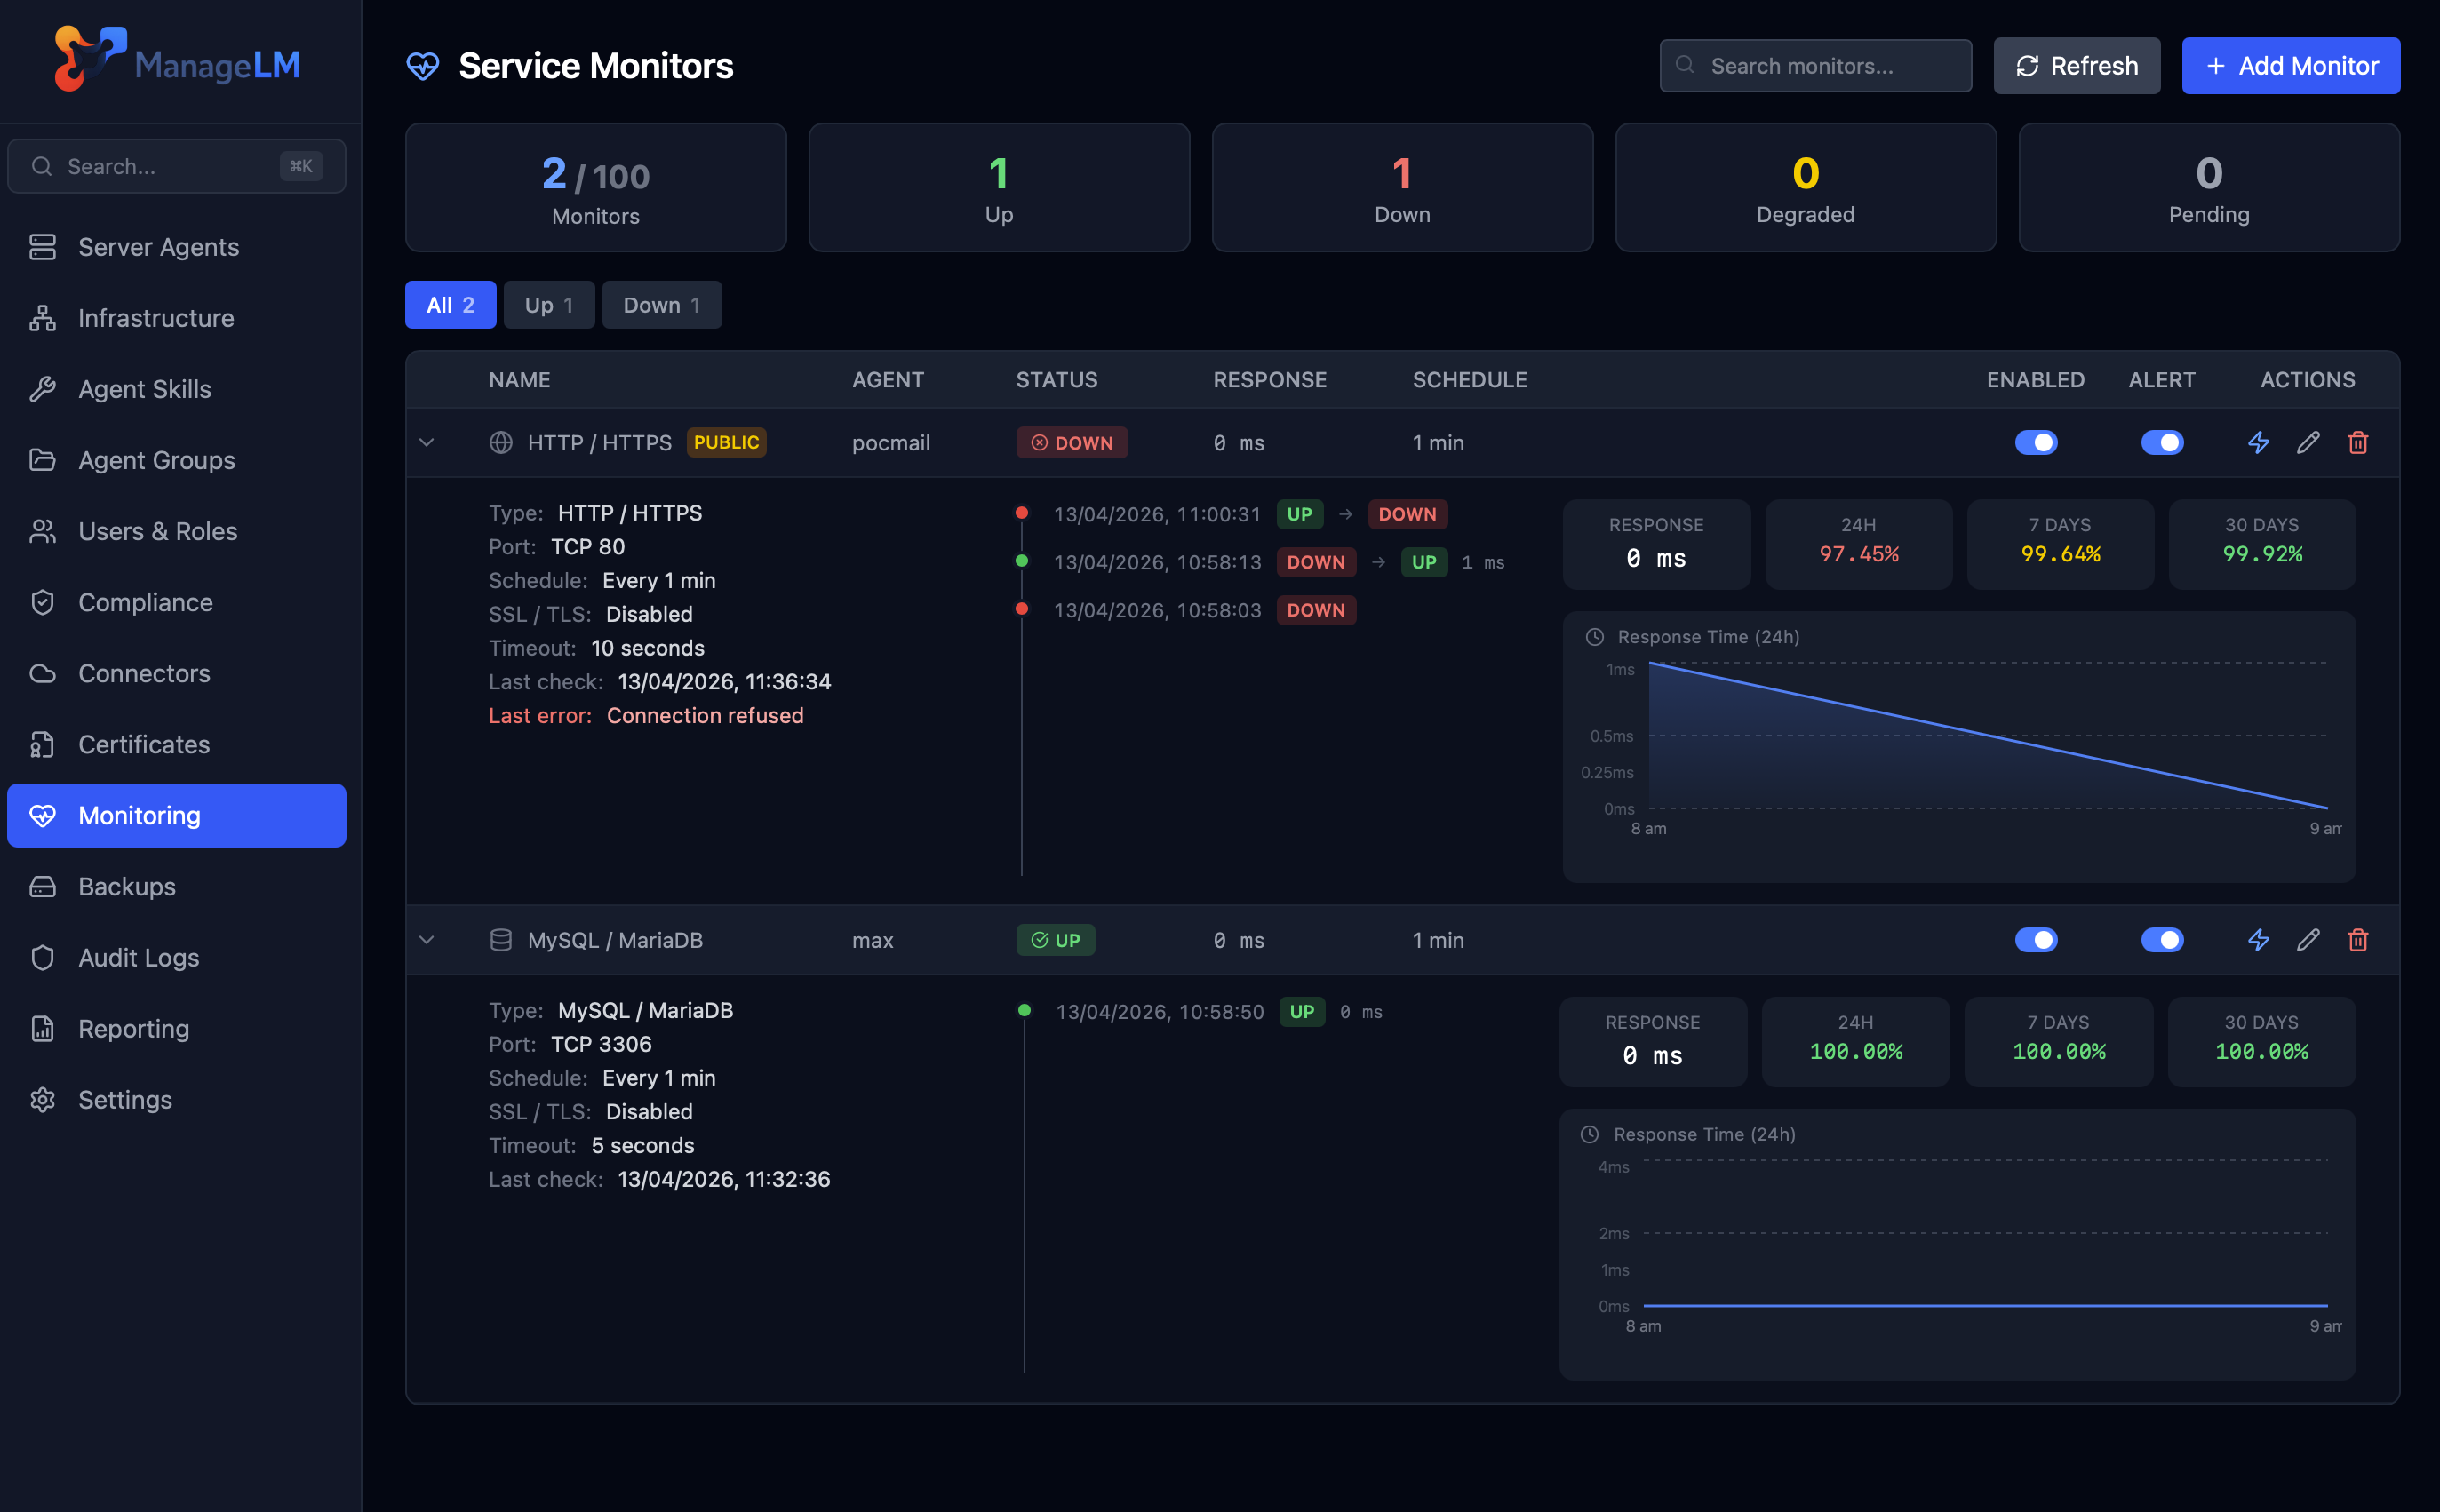
Response time history
Every monitor card shows a sparkline of recent response times pulled from hourly rollups. Click a monitor to see uptime percentages over 24h / 7d / 30d, a full response-time chart, and the status change timeline.
Agent cards on the Infrastructure page carry a summary badge (e.g. "3/3 up" or "1 down") so the first glance at your fleet is also the first glance at its health.
TLS & certificate expiry
Any TCP or HTTP monitor can be flipped into TLS mode with a single toggle. The agent validates the chain and reports days remaining until expiry — configurable warn threshold, configurable alert threshold. It works even for self-signed certificates since the agent can explicitly trust an internal CA.
Replace three tools with one. Between TCP checks, HTTP probes, DNS lookups, and cert expiry alerts, ManageLM monitors cover what most teams need from Pingdom, UptimeRobot, and Nagios combined — from inside your network, without the overhead.
Watch everything that matters.
Add your first monitor from the portal — test the check before saving, get alerts the moment something breaks.